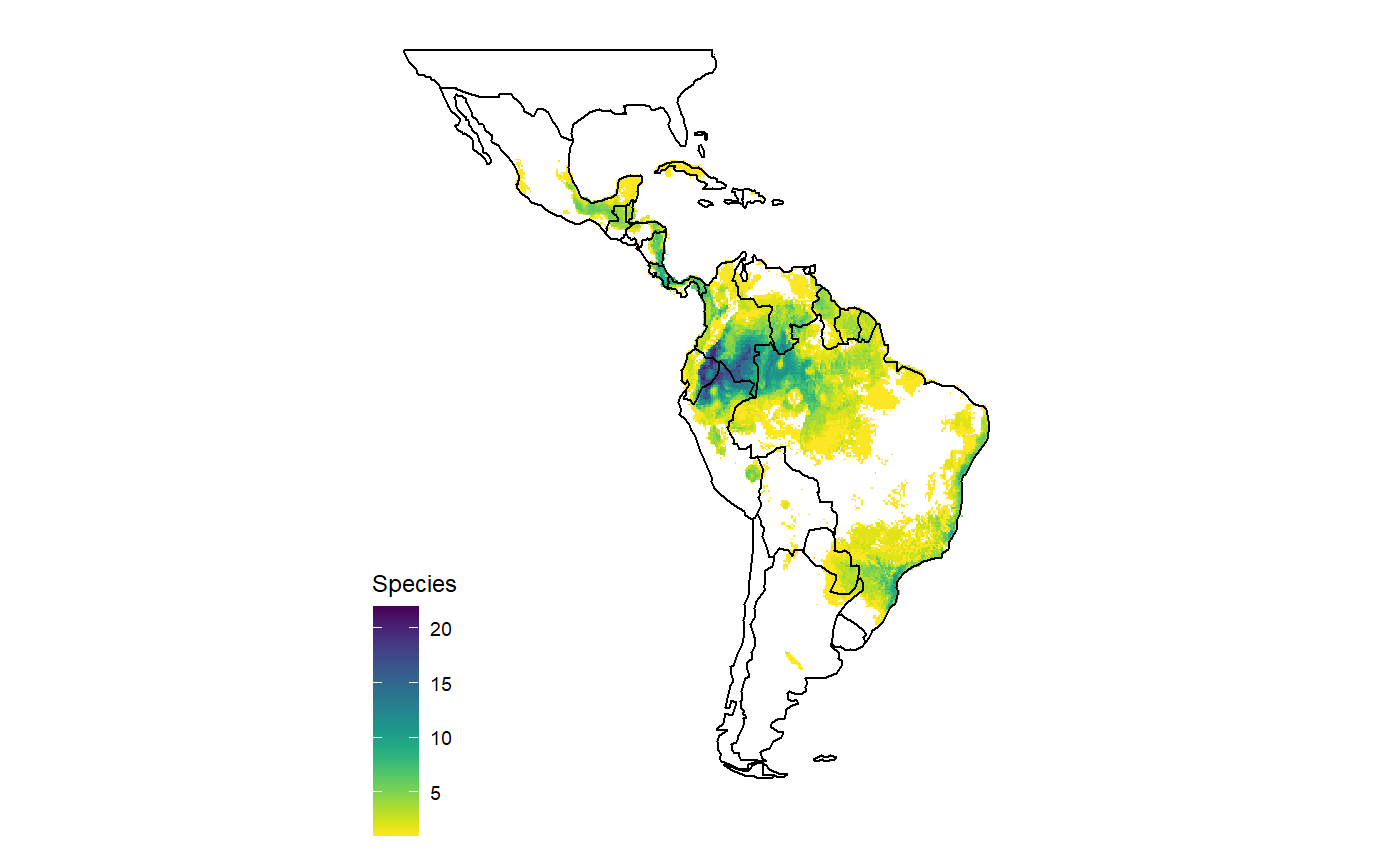
Mapping Bromeliad Species Richness
map_richness.RdProduces a richness map in a 100x100 km grid for the selected bromeliaceae species.
map_richness(x, title = NULL)
Arguments
| x | an object of the class “bromeli” generated by get_range. |
|---|---|
| title | An optional title to be added to the plot. |
Value
aa richness map of the selected taxa across the Neotropics. .
Examples
#> OGR data source with driver: ESRI Shapefile #> Source: "C:\Users\az64mycy\AppData\Local\Temp\Rtmp8Wiiib", layer: "ne_110m_admin_0_countries" #> with 177 features #> It has 94 fields #> Integer64 fields read as strings: POP_EST NE_ID#>#> Warning: Removed 651510 rows containing missing values (geom_tile).